Concrete has numerous properties that can be studied and recorded, but its compressive strength has generally been the center of attention. Indeed, in most projects, structures will use mix designs with the main focus being to reach a certain compressive strength as well as flowability and air content requirements. The most direct way to obtain such information on concrete compressive strength is sampling companion cylinders to be tested for compression. However, this method is inconvenient and may be inaccurate. Fortunately, there is a way around this: the maturity curve.

What is the Concrete Maturity Curve and Why Does it Matter For Testing Concrete Strength?
To begin, concrete maturity is an index, a numerical parameter, that indicates a relative age of the concrete according to its cure. A concrete cure is mostly defined by its temperature. During curing, concrete will gain strength at a temperature-dependent rate, which is what maturity aims to represent. For example, concrete that is kept at 60°F (16°C) will have a much slower strength gain rate than one from the same mix that is kept at 81°F (27°C), but both values are acceptable according to ASTM C31/C31M: Standard Practice for Making and Curing Concrete Test Specimens in the Field. The maturity parameter allows practitioners to consider the temperature evolution of the concrete since its pour, meaning that the strength difference will be known among both samples referenced in the example. To achieve such calculations, the maturity curve must be known. The maturity curve is the relation between the maturity of the concrete and its strength. Overall, with the temperature curve, a time-maturity relation can be established. With the maturity curve, it can be converted to a time-strength relation, giving the strength at any given time.
Click here for more information on concrete maturity.
How is Concrete Maturity Measured?
As stated previously, maturity depends on the concrete temperature. More precisely, it measures the cement hydration, which will stop when the concrete temperature is lower than a certain temperature, termed the datum temperature, T0 . Consequently, it is the difference between the datum temperature and the actual average concrete temperature that is important. A simpler way to understand this relation is to see it as the area under the temperature-time curve. As an example, let’s imagine that the maturity is to be calculated for the following concrete pour and assume the datum temperature to be 0°C.
Figure 1: Time- Temperature Curve – Area Under a Curve Example
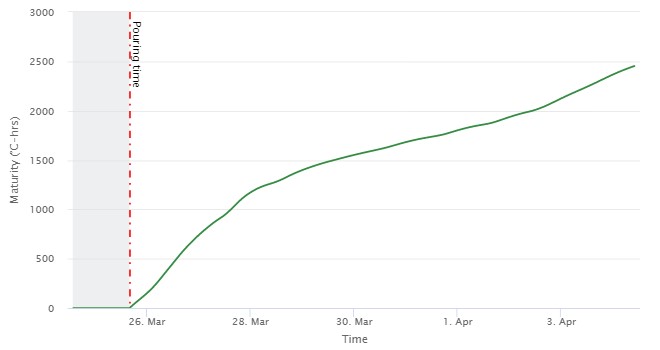
Then, if the maturity is to be calculated on March 27th, then it is simply the area under the temperature curve (highlighted in green.) In this case being 750 °C-hrs, which can be seen in the time-maturity plot that follows. The maturity on March 27th is calculated higher: 750 °C-hrs. Note that the same calculations could have been done using Fahrenheit degrees.
There exists a simple formula to describe this calculation:
Where M(t) is the time-dependent maturity (degree-hours), Ta </p is the average temperature measured in the concrete from its pour (°C), T0 is the datum temperature (°C) and ∆t is the time interval (h) since the pour. Essentially, the temperature of the concrete is measured at frequent intervals in order to get an average and then the maturity value from the equation shown above at a certain time.
ASTM C1074 – Standard Practice for Estimating Concrete Strength by the Maturity Method states that the time interval between temperature measures should not be over 30 minutes for the first 48 hours and 1 hour afterwards. With these measures, it is possible to graph an accurate maturity curve for a specific pour.
For more information on the concrete maturity calculation method, click here.
How is the Maturity Curve Calculated?
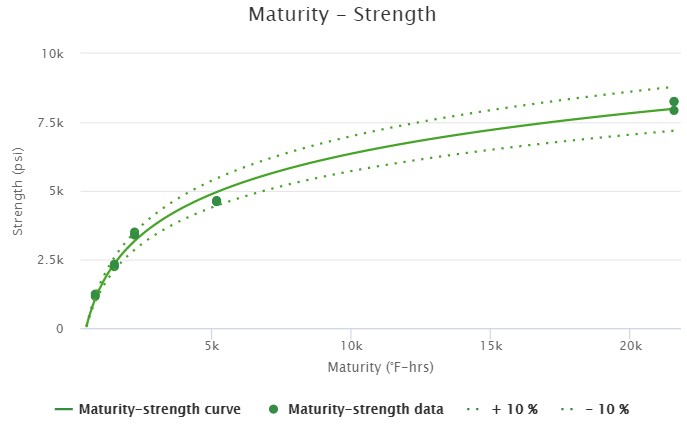
The maturity curve, or strength-maturity relationship, is developed for a mix with precise steps specified in ASTM C1074. Overall, 17 concrete cylinders are cast with the desired mix design and 2 of them have temperature sensors embedded. The cylinders are cured in a water tank at 73 ± 4°F (23 ± 2°C) in order to be tested for compression at 1, 3, 7, 14, and 28 days. At each testing, 3 samples are to be tested. If some results have more than a 10% difference from the average, the low-test results should be taken again with the supplementary cylinders made at the beginning. At each testing age, the maturity index is measured based on the temperature records of the sensors and with the procedure described higher. The average compressive strength results are plotted according to the maturity. Then, the best-fit curve for the strength-maturity plot is the maturity curves. See the example below.
This relationship can be described with a logarithmic curve using 2 factors, A and B:
Where S(t) is the concrete strength (MPa), M(t) is the maturity (°C-hrs), while A and B are the factors depicting the curve. This curve can then be validated to make sure the factors are right for the mix design. To do so, field-molded cylinders are made on site, supplemented with temperature/maturity sensors. When the maturity method indicates that the samples reached their target strength, the actual compressive strength is measured in order to compare the maturity prediction with the actual value. If the difference between these values exceeds 10% consistently, the maturity curve found does not represent the mix design well and should be developed again. This method is part of ASTM C1074, which provides more details and explanations on the validation process.
Moreover, with the Giatec 360 system, Giatec’s artificial intelligence, Roxi™, can be used to validate the strength maturity relationship. This AI assistant can, based on the concrete mix proportions, determine if the maturity-strength relationship developed is accurate or if human errors occurred during the process. Combined with the ASTM C1074 validation method, Roxi ensures that the concrete maturity curve is optimal and yields precise compressive strength values.
Click here to learn more about Roxi.
Why Is the Maturity Curve Important?
Quite simply, the maturity curve allows for maturity measures to be converted to strength values. As explained earlier, with temperature measurements of a concrete element, the time-temperature curve can be developed. With the maturity equation, this curve can be converted to a time-maturity curve. In turn, this curve is finally converted to a time-strength curve, using the strength equation with the A and B factors determined using the maturity curve calibrated for the specific mix design. The maturity curve is a crucial step in the process of determining the in-place strength of a concrete element at any given time. By using wireless concrete temperature sensors like SmartRock®, you can bring intelligent concrete to your construction site and have strength results anytime, anywhere, thanks to the maturity curve.

