
A corrosion mapping test produces a spatial record of electrochemical corrosion state at a point in time. That record has real value. But the map itself does not predict how much service life remains, does not specify what repair is needed, and does not confirm whether an intervention worked. Those answers require connecting the mapping data to the decisions that follow it.
In this blog, gain an understanding of what corrosion mapping test data actually enables, how it feeds service-life models, how it drives repair design, and what the LaSalle Causeway evaluation shows about detecting corrosion before it becomes visible damage.
What Is a Corrosion Mapping Test?
Corrosion mapping is the systematic measurement of electrochemical parameters across a reinforced concrete surface, presented as spatial contour plots. Three distinct map types are produced from a full survey.
The three maps at a glance:
| Map Type | What It Measures | Unit | What It Tells You |
| Corrosion potential | Probability of active corrosion | mV | Where corrosion has started |
| Corrosion rate (icorr) | Rate of metal loss | µA/cm² | How fast it is progressing |
| Resistivity | Concrete’s resistance to ion flow | ohm·m | Concrete quality and corrosion risk |
Resistivity mapping in particular is sometimes treated as a separate concrete quality test, but in the context of a condition assessment it is an integral part of the corrosion map suite. Without it, neither the rate data nor the potential contours can be interpreted correctly.
Most condition assessments treat the map as the deliverable. Inspectors submit the contour plots, file the report, and queue the structure for maintenance based on visual severity. That workflow reduces electrochemical data, which could have driven quantitative repair prioritization, service-life forecasting, and post-repair validation, to a pass/fail call.
The three outputs of a full electrochemical mapping test each carry specific downstream utility. Corrosion potential contours define the spatial boundary of probable active zones. Icorr values quantify the rate of metal loss and determine repair urgency. Resistivity provides the concrete quality input that service-life models require. Used together and connected to the right analytical framework, they answer questions that the map alone cannot.
See how a full NDT corrosion assessment differs from a single half-cell survey. Read the guide!
How Does Corrosion Mapping Improve Service-Life Prediction?
Service-life prediction for chloride-exposed structures typically uses Fickian diffusion models as the standard analytical framework. The model predicts when the chloride front will reach the rebar depth based on surface chloride concentration, diffusion coefficient, and cover depth. What it cannot supply on its own is the spatial distribution of where that front has already arrived.
Corrosion potential contour maps from half-cell testing identify the zones where depassivation has already occurred. Overlaying those contours onto the diffusion model replaces the assumption of uniform chloride exposure with the measured reality of where initiation has already begun. The result is a spatially resolved prediction of remaining service life, not a single average number applied across the whole structure.
Icorr distributions add a second layer. Where corrosion rate is already elevated above 3 µA/cm², the initiation phase is over, and propagation is underway. In those zones, the relevant prediction is not time to initiation, but time to cover cracking, calculated from the rate of oxide volume expansion against the tensile capacity of the cover. This distinction, initiation versus propagation, determines whether the structure needs monitoring or immediate intervention. Without quantitative icorr data from the mapping test, that distinction cannot be made.
Go deeper on how electrochemical data drives durability decisions in reinforced concrete. Explore the article!
Case Study: How Corrosion Mapping Detected Hidden Corrosion on the LaSalle Causeway
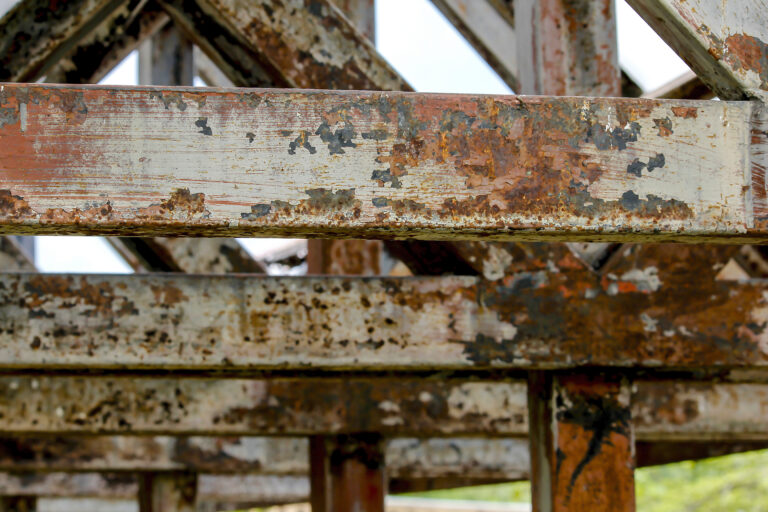
The LaSalle Causeway East Bridge in Kingston, Ontario, opened in 1969 and carries approximately 23,000 vehicles per day across the Cataraqui River. Visual inspection and hammer sounding identified significant damage near the central pier, where salt-laden water had been seeping through a deck joint for years (Concrete International, February 2019). No damage was visible between the pier and the abutments.
Corrosion rate and potential mapping told a different story. Active corrosion was identified in girders 1, 2, 4, 11, and 12 with no corresponding visual or acoustic signal. Those girders were not damaged yet. They were on a measurable trajectory toward damage, with quantified icorr values establishing the rate at which that trajectory was advancing. Without the mapping data, those girders would have entered the next inspection cycle with no flag, and repair scope would have been defined entirely by what was already visible near the pier.
That is the operational value of a corrosion mapping test used correctly. It identifies what is breaking and provides the rate data to estimate when it will require intervention.
How Does Mapping Data Improve Repair Design?
Concrete corrosion repair scoped from visual surveys tends to underestimate the active zone boundary. The visible damage at the surface typically represents the propagation front, not the initiation front. Repairing only the visible area leaves active corrosion immediately adjacent to the patch, where a macrocell effect accelerates deterioration at the repair boundary.
Icorr contours from a pre-repair mapping test define the actual electrochemical boundary of the active zone, not just the visible one. Repair limits set to that boundary rather than to the visible damage extent eliminate the macrocell acceleration problem at the patch edge.
This is not a theoretical refinement. On structures where partial repairs have failed within five years of installation, the root cause is consistently the same: repair boundaries set by visual extent rather than by electrochemical state.
Resistivity data from the same survey feeds cathodic protection design directly. Impressed current cathodic protection (ICCP) current density requirements are a function of concrete resistivity in the active zone. In splash zone elements where resistivity drops below 5 ohm·m, the current demand is substantially higher than in atmospheric exposure zones. Designing ICCP without pre-repair resistivity mapping produces systematic under-protection in the highest-activity areas, which is where it matters most.
Learn how to scope repairs that hold up against macrocell acceleration at the patch edge. Read the repair guide!
Repeat Mapping as Post-Intervention Validation
A pre-repair corrosion mapping test serves a second function that teams consistently underuse: it establishes the baseline that lets you measure post-repair performance. Without a pre-repair map, post-repair mapping produces a result with no reference point. The question “did the intervention work?” cannot be answered quantitatively.
Galvanic anode installations call for post-installation mapping to evaluate whether the polarization shift meets the – 100 mV criterion and whether that shift is spatially uniform across the protected zone or concentrated near the anode locations. With patch repairs, repeat mapping at three- to five-year intervals confirms whether icorr in the zones adjacent to the repair boundary is stable or accelerating. ICCP systems benefit from annual resistivity mapping, which verifies that concrete condition in the protected zone is not degrading in ways that would require current output adjustment.
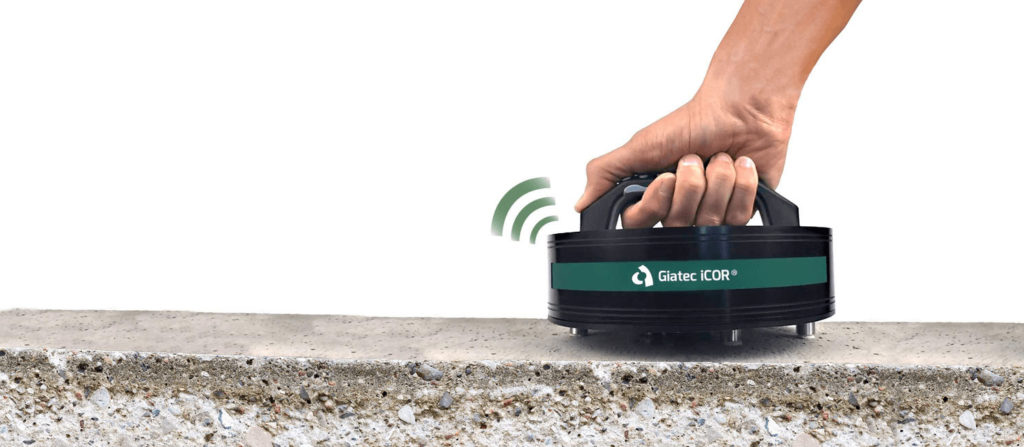
Giatec iCOR® suits repeat survey programs because the connectionless CEPRA measurement eliminates the need to re-establish rebar contact at previously drilled points. Crews can re-survey the same grid without any surface preparation beyond cleaning, which makes repeat mapping at defined intervals operationally practical rather than logistically burdensome.
How to Interpret the Three Maps Together
No single parameter from a corrosion mapping test is self-interpreting. The same icorr value carries different implications depending on the resistivity of the surrounding concrete and the potential gradient in adjacent zones. Correlating the three parameters spatially is what converts raw mapping data into actionable information.
A specific combination improves accuracy in carbonated zones. The Stern-Geary B-value, which calculates icorr from polarization resistance, typically sits at 26 mV for passive steel. In carbonated concrete, the reduced hydroxyl gradient at the rebar surface shifts the B-value toward 52 mV. Applying the passive assumption in a carbonated zone underestimates icorr by up to 50% . Identifying carbonated zones through potential mapping, where potentials are moderately negative despite active corrosion, and adjusting the B-value accordingly produces a more accurate rate estimate without additional measurements.
Resistivity and potential maps also identify the mechanism driving corrosion. The repair strategy depends on which mechanism is active:
| Mechanism | Resistivity | Potential | Repair Strategy |
| Chloride-driven | Low | Strongly negative | Barrier or electrochemical protection |
| Carbonation-driven | Moderate | Moderately negative | Re-alkalization or pH-restoring mortar |
For more on analyzing corrosion in reinforced concrete structures, see how mechanism differentiation drives the right repair strategy. Learn more here!
How to Get Full Value from a Mapping Survey
Four decisions before the survey begins determine whether the data drives outcomes or generates a report:
- Set grid spacing to 0.5 m for bridge decks and parking structures where repair boundaries need precision.
- Use directional X/Y scanning on any structure with oriented cracking. Single-axis measurement can underreport resistivity variance by up to 25%.
- Record measurement locations precisely so the exact grid can be re-surveyed post-intervention. That repeatability is what makes post-repair validation quantitative.
- Prioritize icorr and resistivity over potential alone when budget constrains scope. Rate and concrete condition data are more actionable than probability contours.
Key Takeaways
- Corrosion mapping produces three distinct map types: corrosion potential, corrosion rate (icorr), and resistivity; all three are part of the mapping suite and none is sufficient alone
- Resistivity mapping is not a separate test in a condition assessment context; it is an integral output required to interpret potential and rate data correctly
- Corrosion potential contours identify where chloride-driven depassivation has already occurred, replacing uniform diffusion assumptions with measured spatial reality
- icorr values distinguish initiation from propagation: above 3 µA/cm² the relevant prediction shifts from time to initiation to time to cover cracking
- Repair limits set to electrochemical boundaries rather than visual extent eliminate macrocell acceleration at patch edges
- Pre-repair mapping establishes the baseline that makes post-repair validation quantitative rather than qualitative
- Grid spacing, directional scanning, and parameter selection must be defined before the survey begins, not after
- iCOR connectionless measurement makes repeat grid surveys operationally practical without re-establishing rebar contact
Conclusion
A corrosion mapping test is the most information-dense tool available for reinforced concrete condition assessment. The limiting factor is not the data it produces. It is whether that data is connected to service-life models, repair boundary decisions, and post-intervention monitoring programs that put it to use.
Frequently Asked Questions
What is a corrosion mapping test used for in structural assessment?
A corrosion mapping test produces spatial contour maps of corrosion potential, corrosion rate, and electrical resistivity across a reinforced concrete structure. The outputs identify the location and extent of active corrosion, quantify the rate of metal loss, and characterize concrete quality in terms of ion transport resistance. Used correctly, the data feeds service-life prediction models, defines repair boundaries more accurately than visual inspection, and establishes the baseline for post-intervention validation.
How does corrosion mapping data contribute to service-life prediction?
Corrosion potential contours identify zones where chloride-driven depassivation has already occurred, replacing the uniform exposure assumption in Fickian diffusion models with the measured spatial distribution of initiation. Icorr values separate zones still in the initiation phase from those already propagating, which determines whether the relevant prediction is time to initiation or time to cover cracking. Together, these inputs convert a single average service-life estimate into a spatially resolved forecast that reflects actual structural condition.
How does a pre-repair corrosion map improve repair outcomes?
Pre-repair icorr contours define the electrochemical boundary of the active corrosion zone, which typically extends beyond the visible damage boundary. Setting repair limits to the electrochemical boundary eliminates the macrocell acceleration that occurs when active corrosion is left immediately adjacent to a patch. Pre-repair resistivity data also feeds cathodic protection design, ensuring that current density requirements are matched to actual concrete condition in each zone rather than assumed from generic exposure class criteria.
How often should corrosion mapping tests be repeated on aging infrastructure?
Repeat interval depends on the rate of propagation measured in the initial survey and the type of intervention applied. Untreated structures with icorr above 3 µA/cm² in active zones warrant a three- to five-year repeat interval, which tracks propagation rate and updates intervention timing forecasts. Structures with galvanic anode or ICCP systems installed need annual or biennial mapping to validate that polarization criteria are being met and that concrete condition in the protected zone is stable. For more detail, see understanding and monitoring corrosion in steel reinforced concrete.
What is the difference between corrosion mapping and a half-cell potential test?
A half-cell potential test measures a single parameter: electrochemical potential, at discrete points or across a grid, producing a probability-of-corrosion contour. Corrosion mapping encompasses the full three-parameter assessment: potential, corrosion rate, and resistivity measured simultaneously and mapped spatially. The half-cell test identifies where corrosion is likely. The full mapping test quantifies how fast it is progressing and what the concrete condition means for repair design and service-life prediction.