
Corrosion mapping equipment measures the electrochemical state of reinforcement across a defined survey area and presents the results as spatial contour maps. The gap between what these maps reveal and what a visual inspection finds is not a margin of error. It is the difference between detecting active corrosion before structural damage begins and responding to it after it has already occurred.
In this blog, gain an understanding of why conventional survey methods miss active corrosion, how electrochemical mapping equipment works, what variables affect result accuracy, and what field data from two real bridge evaluations show about the cost of acting too late.
What Conventional Survey Methods Can and Cannot Detect
Visual inspection and acoustic methods, such as hammer sounding and chain-dragging, according to ASTM D4580, are still the starting point for most condition assessments. They are fast, require no equipment setup, and identify delamination and spalling reliably once those conditions exist.
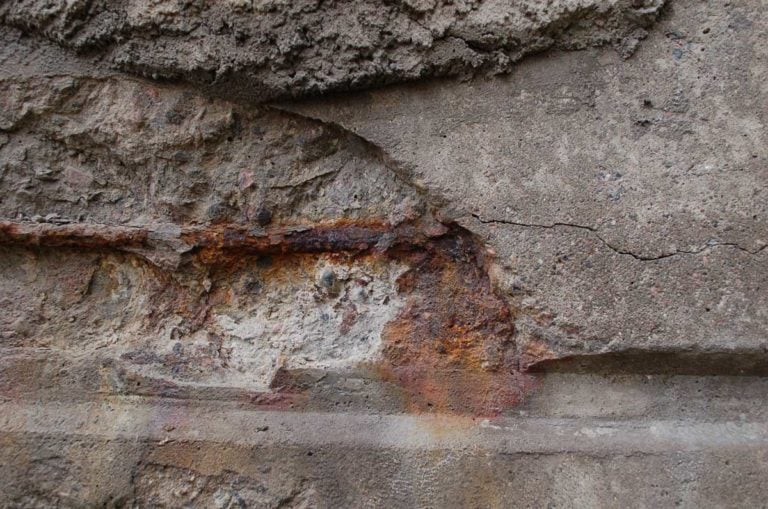
The limitation is structural. Both methods require corrosion to have already propagated far enough to crack or separate the cover before they register anything. By that point, the reinforcement has been losing cross-section for years. The question is not whether the methods work. The question is what they miss while they are waiting for visible damage to appear.
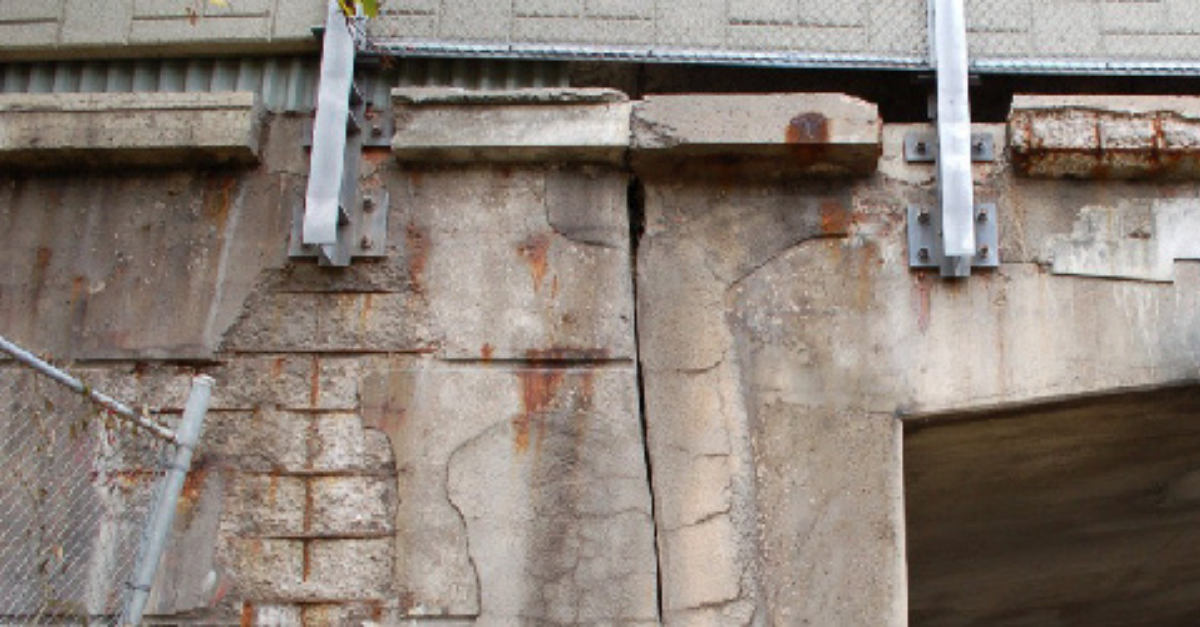
At the Three Nations Bridge in Cornwall, Ontario, a suspension bridge opened in 1958, carrying approximately two million vehicles per year. Visual inspection and chain-dragging identified delaminated zones distributed across the deck. Electrochemical mapping identified active corrosion across 40 to 60% of the total deck surface, including zones that produced no acoustic response and showed no visible damage. That gap is not an anomaly. It is what active corrosion looks like before it becomes visible.
The Three Parameters That Define Corrosion State
Electrochemical corrosion mapping characterizes the reinforcement condition through three parameters, each measuring something different and insufficient on its own.
- Corrosion potential (half-cell, ASTM C876) measures the electrochemical potential difference between the rebar and a reference electrode at the surface. It indicates the probability that corrosion is occurring. It does not measure how fast. Readings more negative than −350 mV versus Cu/CuSO₄ indicate greater than 90% probability of active corrosion. Readings above −200 mV indicate less than 10% probability. The range between those values is uncertain.
- Corrosion rate (icorr, in µA/cm²) measures the actual rate of metal loss using polarization resistance. This is quantitative. Below 1 µA/cm² is low activity. Above 10 µA/cm² is severe. The rate determines how much time remains before structural capacity is affected and drives repair urgency decisions.
- Electrical resistivity (ohm·m, Wenner probe) measures the concrete’s resistance to ionic current flow. It is an indirect indicator: resistivity below 5 ohm·m is associated with severe corrosion risk, above 20 ohm·m with low risk. Critically, resistivity is moisture-dependent. Dry concrete can read above 20 ohm·m even when active corrosion is present.
All three together, mapped spatially across a grid, produce the complete picture. Any one of them alone produces a partial one.
Why Rebar Connection Is the Practical Bottleneck
Traditional methods for measuring corrosion rate, such as linear polarization resistance (LPR), require drilling through the cover to establish direct electrical contact with the rebar. On a bridge deck or a multi-level parking structure, that means drilling at every grid point, patching each hole, and spending 10 to 30 minutes per measurement. Large-area surveys become logistically prohibitive. Coverage gets compressed. The map that results reflects a fraction of the actual surface.
The table below summarizes the practical constraints of each method across the full assessment toolkit.
| Method | What it measures | Rebar connection | Output type | Key field constraint |
| Visual inspection | Surface damage | None | Qualitative, location only | Detects only after delamination |
| Acoustic (chain-drag / hammer sounding) | Cover delamination | None | Qualitative, location only | Detects only after cracking |
| Half-cell potential (ASTM C876) | Corrosion probability | Required | Qualitative, probabilistic | Does not measure rate |
| Linear polarization resistance (LPR) | Corrosion rate (icorr) | Required | Quantitative | 10–30 min/point; requires drilling |
| CEPRA (iCOR®) | icorr + resistivity + optional half-cell | Not required | Quantitative, three-in-one | Cover input 10–90 mm; surface must be unobstructed |
Half-cell potential testing with equipment also requires a rebar connection for the reference circuit, though the measurement itself is faster. It provides the probability contour but not the rate. For a full three-parameter assessment without drilling, a different measurement approach is required.
How iCOR® Eliminates the Connection Requirement
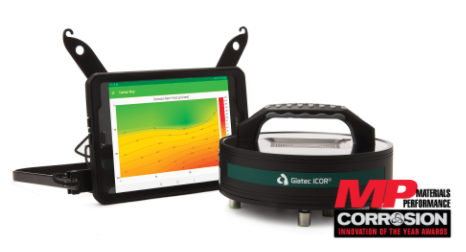
iCOR implements Connectionless Electrical Pulse Response Analysis (CEPRA), a patented technique developed by Giatec Scientific that determines polarization resistance from the concrete surface without rebar contact.
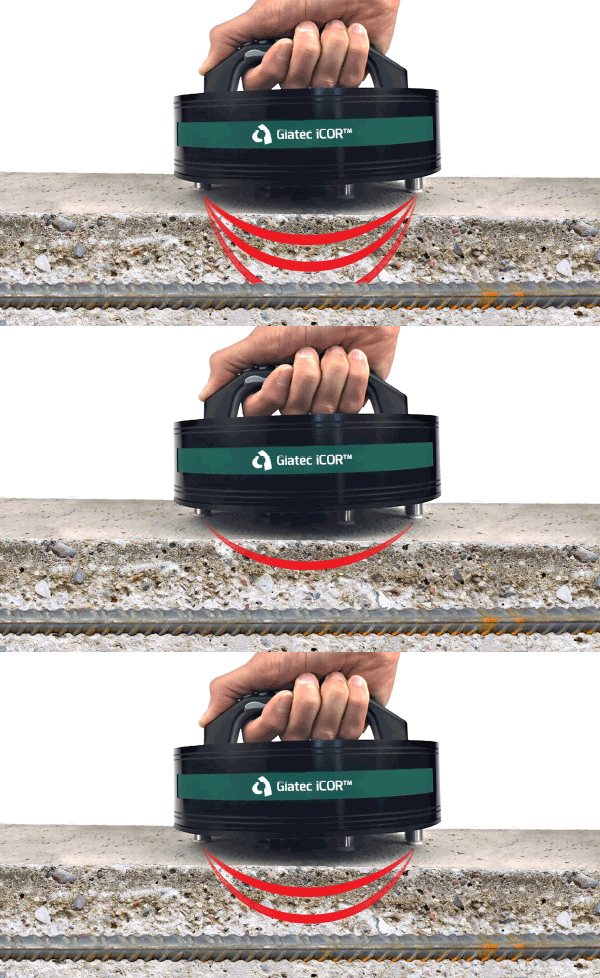
The physics is straightforward. A narrow DC/AC pulse is applied through the outer two probes of a four-probe Wenner array for approximately six seconds. Voltage is recorded between the inner probes at a high sampling rate. Passive rebar produces a rising voltage response at low frequencies because polarization resistance is high. Corroding rebar produces a flat response because polarization resistance is low. The device extracts Rp from the transient and calculates icorr using the Stern-Geary equation. The polarization zone is self-confined, which eliminates the lateral current spread error that affects standard LPR and introduces uncertainty in the polarized bar area.
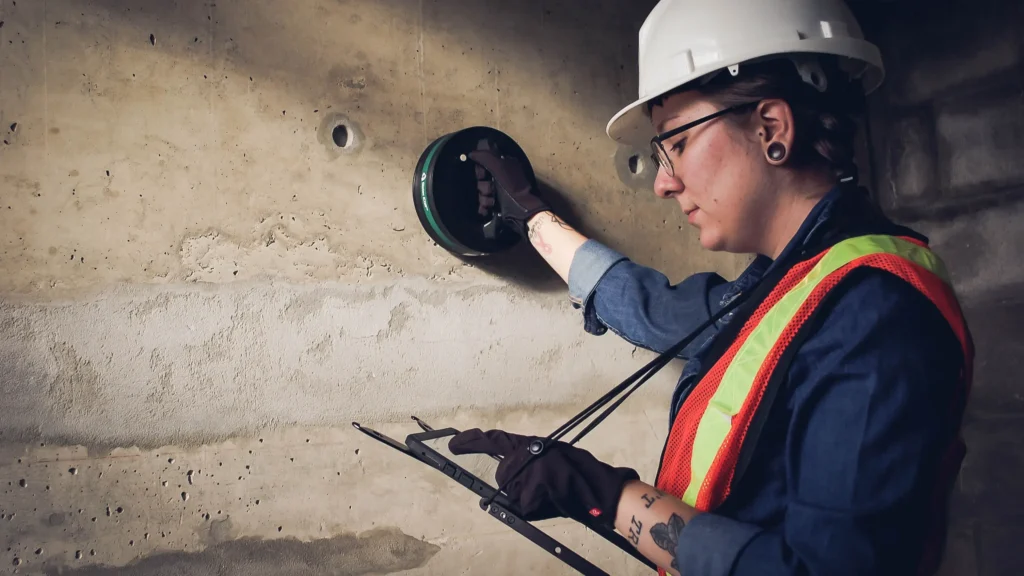
A single iCOR measurement takes approximately six seconds and delivers three simultaneous outputs: corrosion rate (icorr), intrinsic electrical resistivity, and concrete cover resistance. Half-cell potential is available as an optional fourth output when rebar connection is accessible. The device performs directional measurements independently in X and Y axes, which is critical in structures with oriented cracking, where a single-direction scan can underreport damage extent by up to 25%.
Laboratory validation confirmed CEPRA corrosion rate predictions fell within the accepted 0.5× to 2× correlation band against ASTM G1 mass-loss gravimetry across 16 specimens, chloride contents 0 to 6% by cement weight, and cover depths 20 to 70 mm. One known limitation: in saturated, low-resistivity concrete with small-diameter bars (10M, 11.3 mm), CEPRA overestimates passive icorr at 0.6 to 0.8 µA/cm². Under typical semi-saturated field conditions, the bias does not appear. For a full comparison of how iCOR compares to conventional corrosion assessment methods, the linked blog covers the practical differences in detail.
What the Three Nations Bridge Data Shows
The Three Nations Bridge evaluation used the full method combination: visual inspection, chain-dragging, half-cell potential, corrosion rate, and electrical resistivity mapping across the complete deck span.
The resistivity readings across the deck, measured under dry conditions, ranged from 100 to 500 ohm·m, well into the low-risk category by resistivity criteria alone. Corrosion rate and half-cell results told a different story: active corrosion in the center zone and the East lane near both borders, in areas producing no acoustic response. The dry-condition resistivity was elevated by surface moisture conditions, not by actual low corrosion risk. Without the paired icorr data, the resistivity map would have cleared a deck that was actively deteriorating.
The electrochemical results also distinguished corrosion-driven damage from freeze-thaw and salt-scaling damage in adjacent zones, which something visual methods cannot do. That distinction determines which repair method applies and prevents misallocation of rehabilitation budget across the wrong mechanism.
A Practical Perspective on Method Combination
Assessing corrosion in concrete with a single method always produces a partial picture. Visual and acoustic methods should still begin every assessment. They are fast, require no setup, and bound the area of interest. iCOR three-in-one electrochemical mapping then defines corrosion state spatially across that area, with half-cell potential added where probability contours are required by specification or as inputs to a service-life model.
The combination changes three decisions. It shifts repair timing from reactive to preventive by detecting active corrosion before visible damage appears. It determines the correct repair method by separating corrosion-driven zones from freeze-thaw zones. And it provides the quantitative icorr data that service-life estimation requires, data that visual surveys structurally cannot deliver.
Key Takeaways
- Corrosion mapping equipment measures the electrochemical corrosion state spatially, not just at a single point
- Visual and acoustic methods cannot detect active corrosion before it causes cracking or delamination
- The Three Nations Bridge data shows that resistivity and electrochemical corrosion state can point in opposite directions under dry conditions, so treating them independently leads to the wrong assessment call.
- The 3 parameters: potential, corrosion rate, and resistivity, each measure something different; none is sufficient alone
- Resistivity is moisture-dependent and must always be interpreted alongside icorr, not independently
- iCOR delivers corrosion rate, resistivity, and cover resistance in approximately six seconds without rebar connection
- CEPRA validation confirmed predictions within the 0.5× to 2× ASTM G1 mass-loss band across cover depths of 20 to 70 mm
- Electrochemical methods differentiate corrosion-driven damage from freeze-thaw damage; visual methods cannot
Conclusion
The limiting factor in corrosion assessment is not the availability of accurate equipment. It is the gap between what conventional surveys detect and when they detect it. By the time visual methods register active corrosion, the reinforcement has already been losing cross-section, and the repair cost has already been compounding. On the other hand, most electrochemical approaches need rebar connectivity to measure the corrosion parameters.
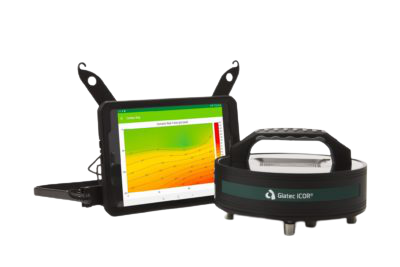
iCOR closes that gap by measuring what is happening in the concrete now, not what has already appeared on the surface. For aging infrastructure managed under tight rehabilitation budgets, the difference between detecting corrosion at initiation versus at delamination is the difference between a targeted repair and a full deck replacement.
Want to learn how concrete degrades over time, and what factors are involved in causing that corrosion? Watch our webinar!
Frequently Asked Questions
What is corrosion mapping equipment used for in concrete assessment?
Corrosion mapping equipment measures the spatial distribution of electrochemical corrosion state across a reinforced concrete structure, producing contour maps of corrosion potential, corrosion rate, and electrical resistivity. The output enables repair prioritization, mechanism differentiation between corrosion and freeze-thaw damage, and service-life estimation.
What is the difference between half-cell potential and corrosion rate measurement?
Half-cell potential testing indicates the probability that corrosion is occurring by measuring the electrochemical potential between the rebar and a reference electrode. Corrosion rate measurement determines the actual rate of metal loss as current density (icorr in µA/cm²) using polarization resistance. Potential is qualitative and probabilistic; rate is quantitative. Both are needed because a strongly negative potential does not confirm how fast the rebar is corroding, and a moderate potential does not rule out active corrosion.
Does corrosion mapping equipment require drilling into the concrete?
Traditional LPR and half-cell methods require direct rebar connection, typically achieved by drilling through the cover. iCOR using CEPRA technology does not. It determines polarization resistance from the surface through a four-probe Wenner array without rebar contact, making it fully non-destructive. The only physical requirement is an unobstructed concrete surface: asphalt overlays, waterproofing membranes, and plastic PT sheathing all block the current path and prevent measurement regardless of which device is used.
How accurate is CEPRA corrosion rate measurement compared to gravimetric methods?
Laboratory validation across 16 specimens at chloride contents of 0 to 6% by cement weight and cover depths of 20 to 70 mm confirmed that CEPRA predictions fell within the accepted 0.5× to 2× correlation band against ASTM G1 mass-loss gravimetry. Accuracy is comparable to LPR methods that require rebar connection, with measurement time reduced from 10 to 30 minutes to approximately six seconds per point. The one exception is saturated, low-resistivity concrete with small-diameter bars, where passive icorr is overestimated. This condition is uncommon under normal field exposure.
Why can resistivity alone not be used to assess corrosion risk?
Electrical resistivity measures the concrete’s resistance to ionic current flow, which correlates with corrosion risk under consistent moisture conditions. However, resistivity rises sharply in dry concrete regardless of actual corrosion activity. At the Three Nations Bridge, dry-condition resistivity readings of 100 to 500 ohm·m placed the deck in the low-risk category, while corrosion rate and potential data identified active corrosion in the same zones. Resistivity is a useful supporting parameter but requires paired icorr data to be interpreted correctly. Read more about how to assess corrosion with NDT methods.