
Service-Life Prediction for Reinforced Concrete Exposed to Chloride-Induced Corrosion Risk: Are We Just Rolling the Dice?
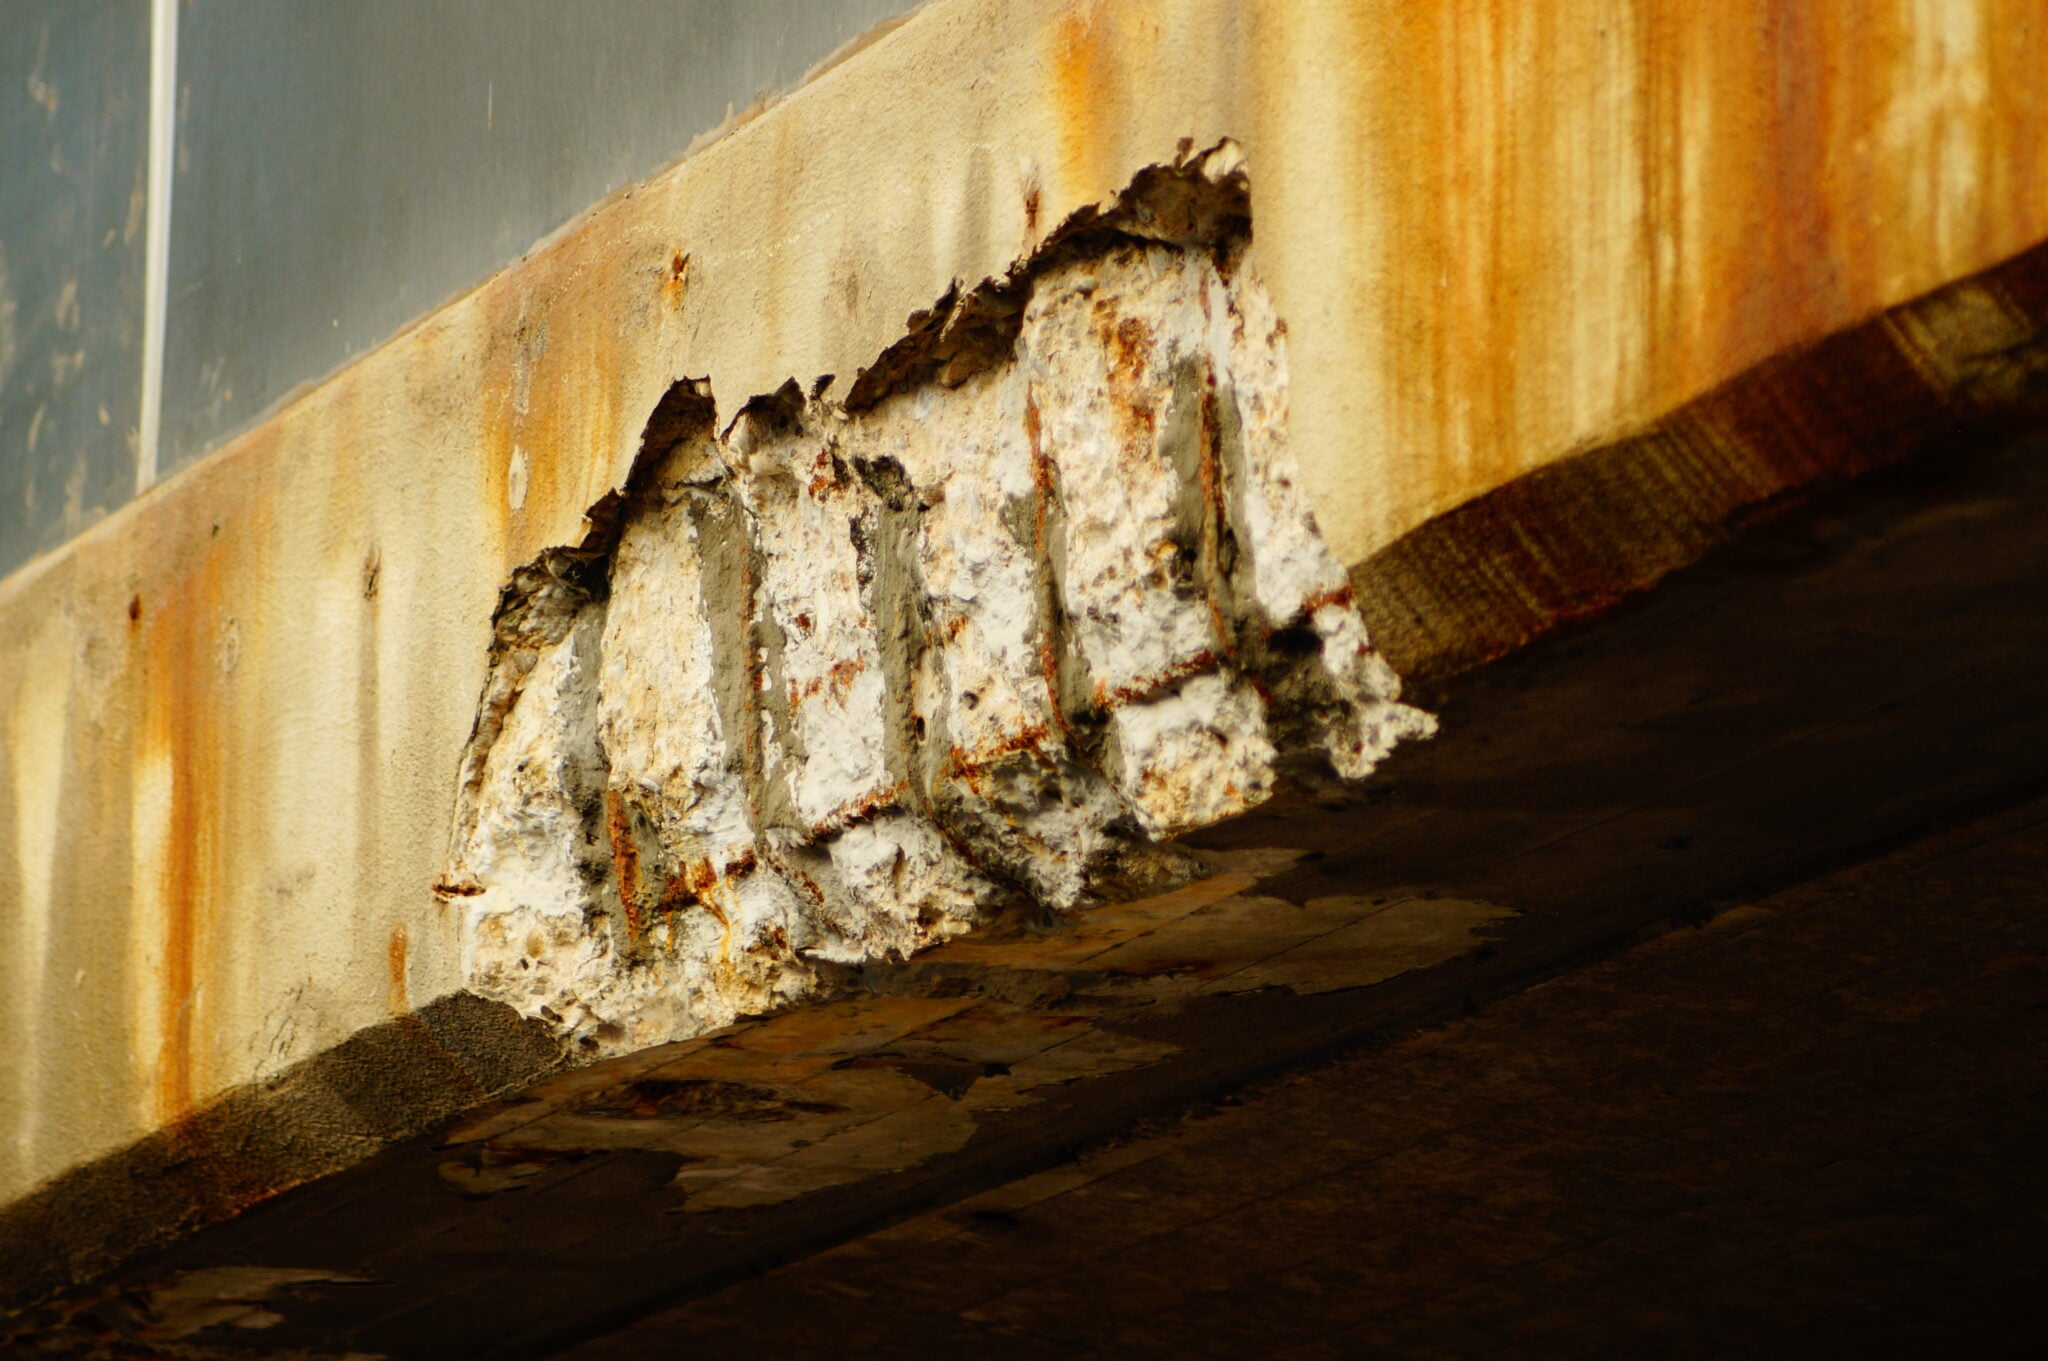
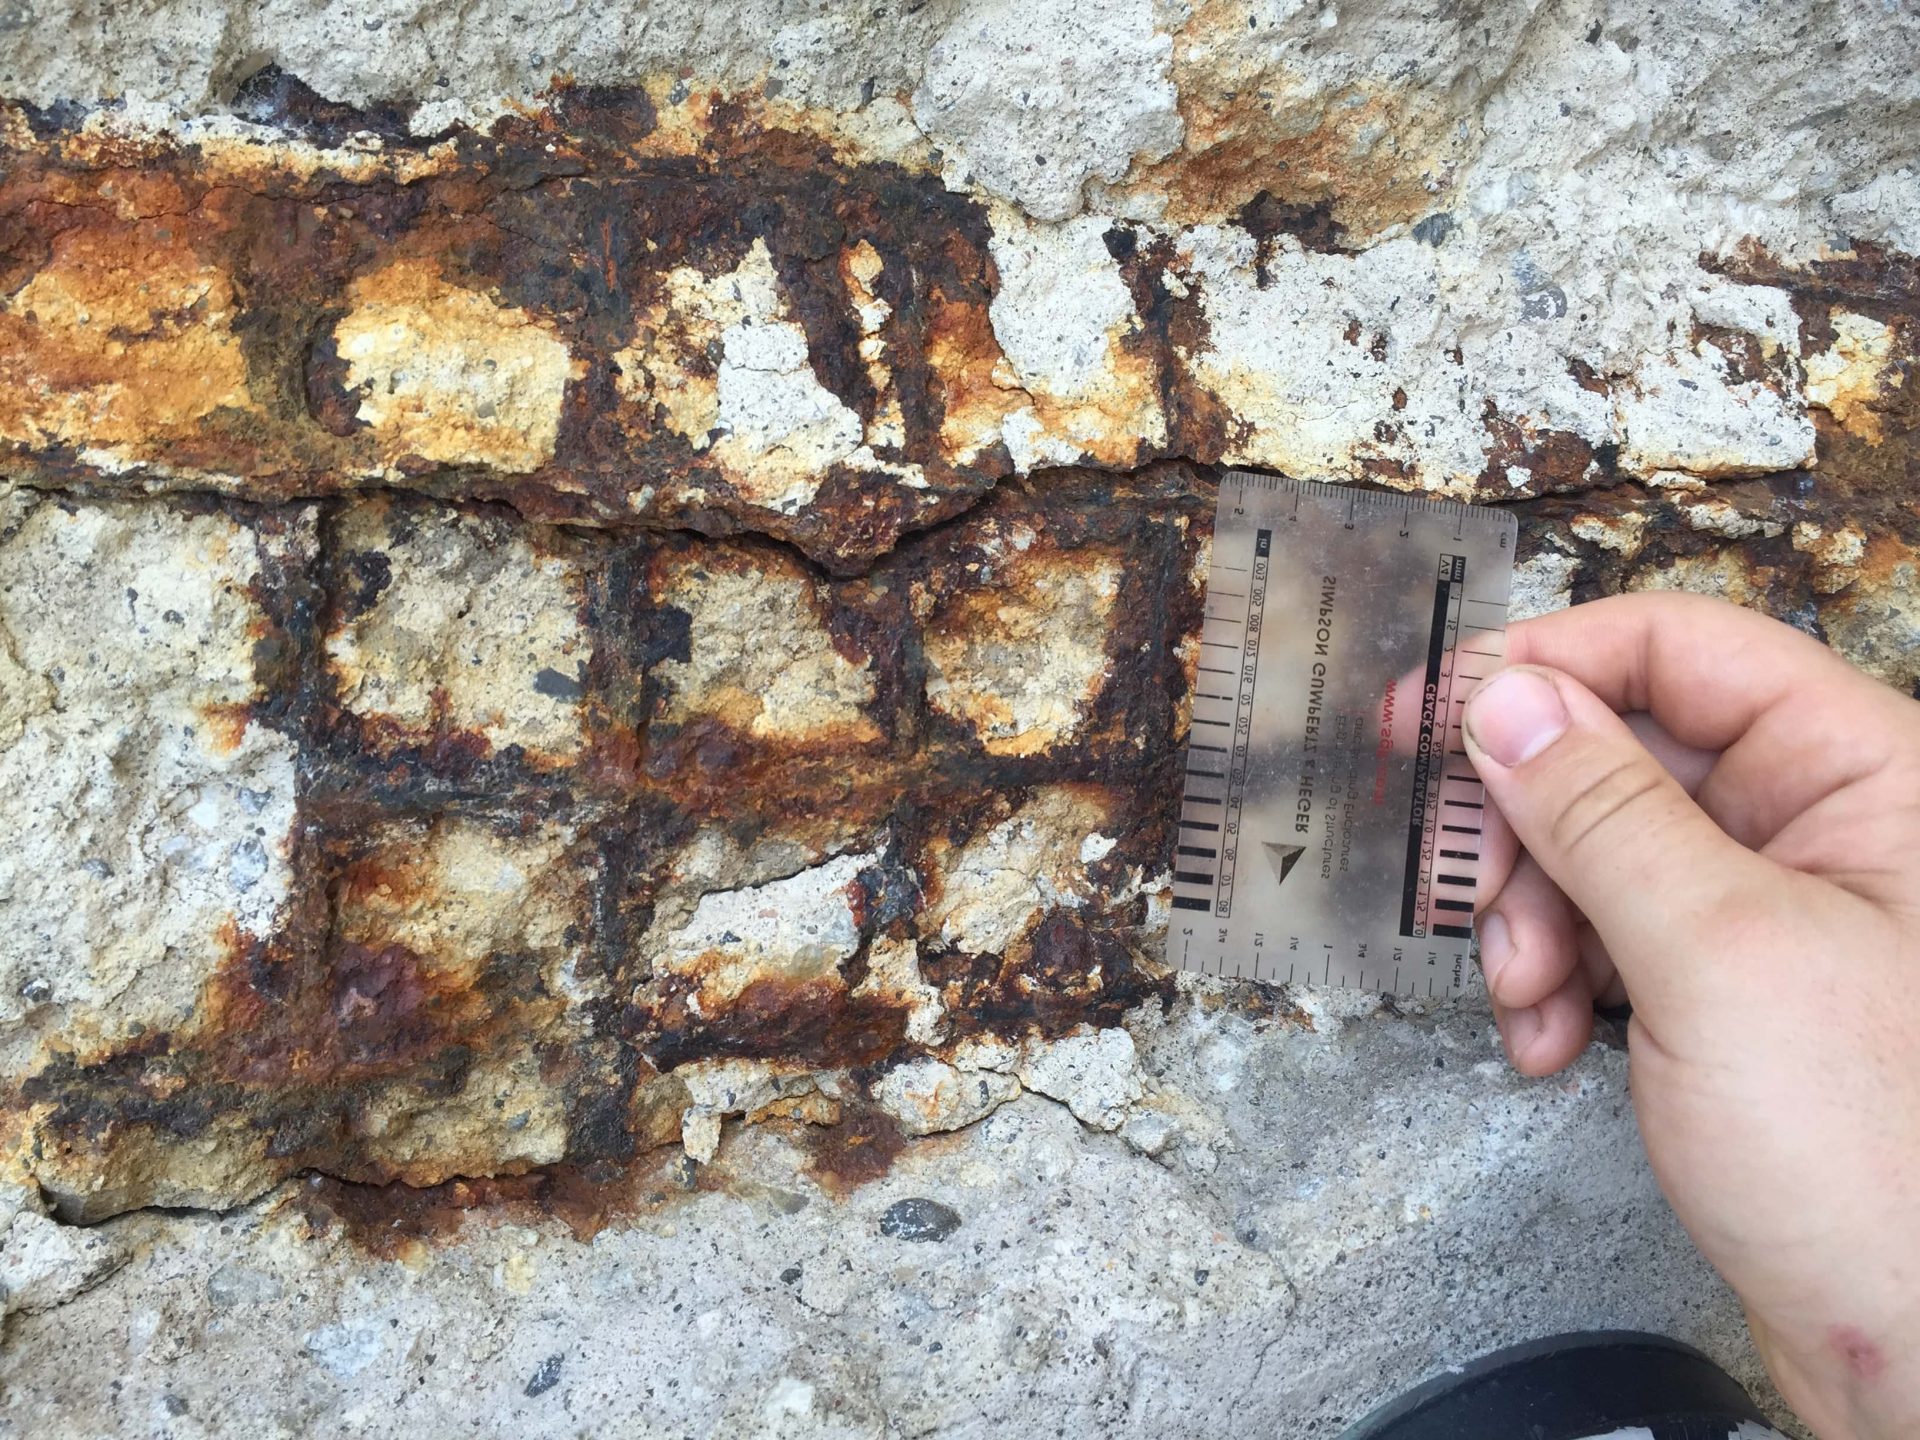
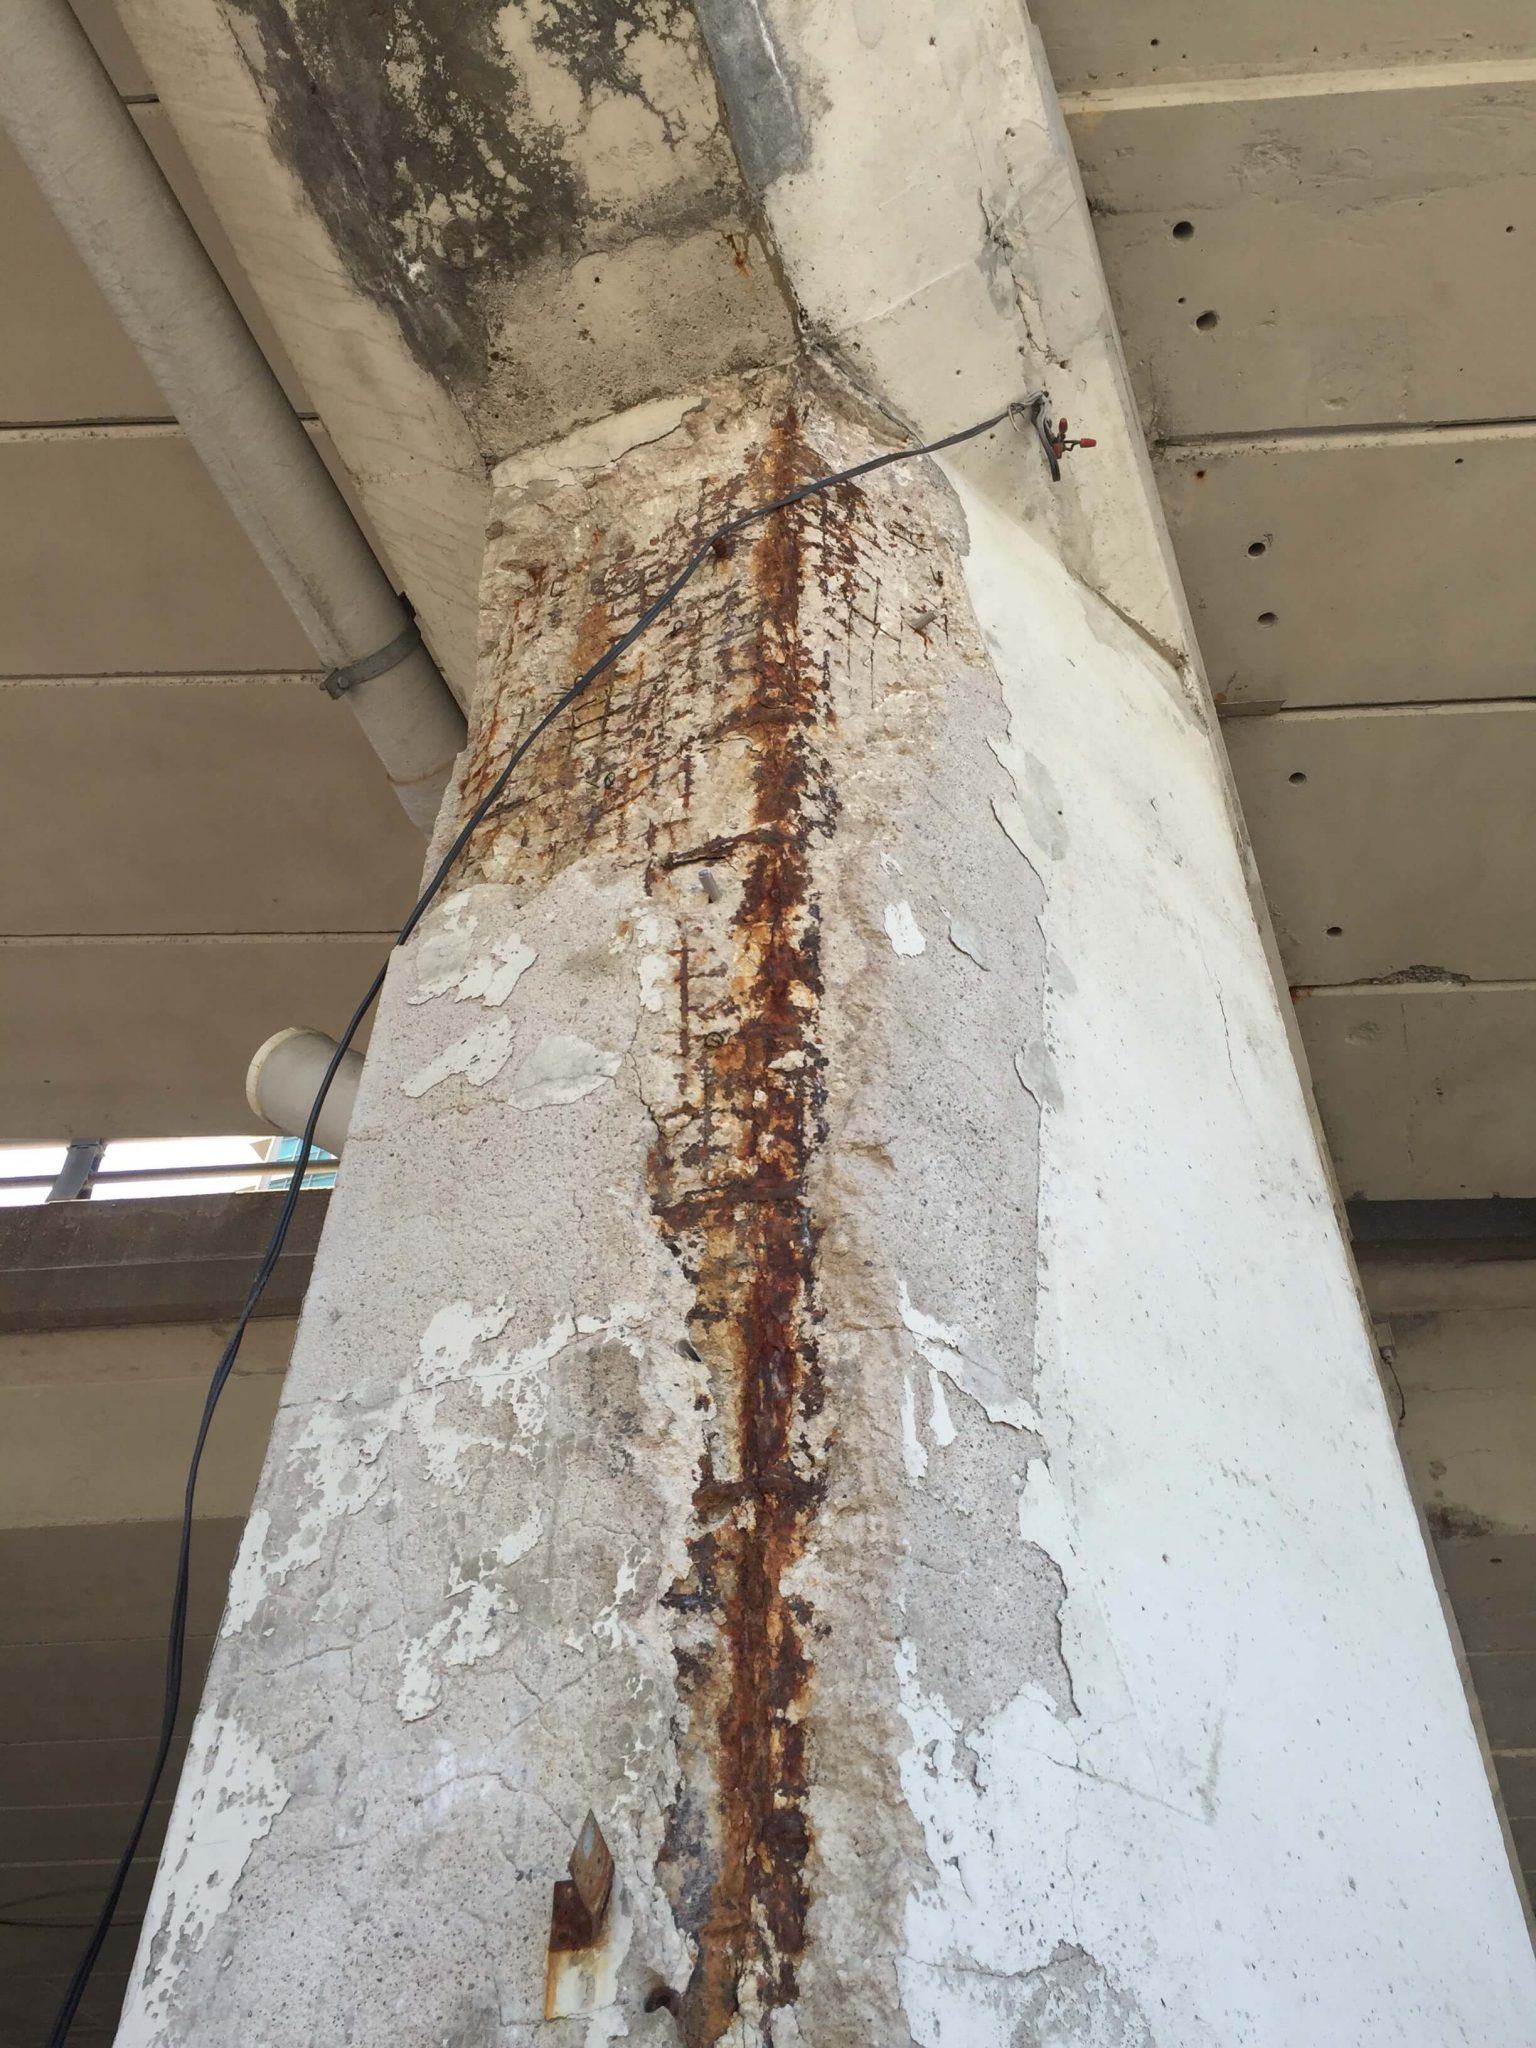
Corrosion of reinforcing steel is the most prominent cause of deterioration in reinforced concrete in North America and many parts of the world. The safety concerns associated with corrosion, along with the billions of dollars spent yearly on repair and rehabilitation, make an accurate estimate of the service-life crucial in ensuring safety and optimizing repairs throughout the life of the structure.
Combating the Number One Cause of Concrete Deterioration
This blog post provides a short summary of the current state of knowledge on service-life prediction; with an emphasis on the uncertainties associated with the parameters chosen for service-life prediction.
Why, When, and How Corrosion Happens
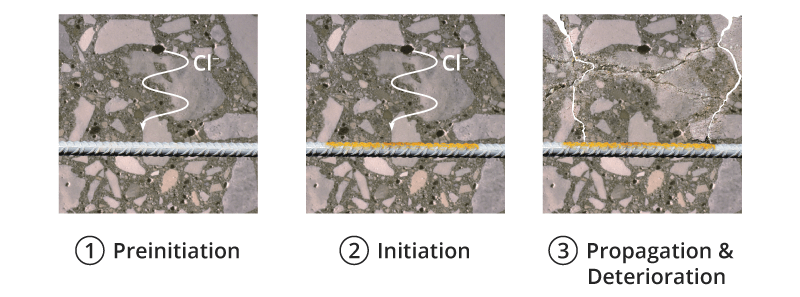
Concrete is a porous material with a pore solution that typically maintains a pH higher than 12.6. Under these alkaline conditions, a thin (nanometer scale) “passive” film forms on the reinforcement surface which effectively stops corrosion. This passive film breaks down due to the exposure to chlorides in sufficient amounts, or the reduction of the pH below a certain critical level (due to carbonation for instance). The time to chloride-induced corrosion initiation can be modeled by predicting the time required for chlorides to reach the reinforcement surface in a concentration equal to the chloride threshold (the chloride concentration required to break down the passive film).
In order to do this, three parameters are required:
- The chloride diffusion coefficient, which describes the propagation/flow of chlorides (or other ions) within the concrete pore network,
- The surface chloride concentration, and
- The chloride threshold, which describes the amount of chlorides required to break the passive film and initiate corrosion.
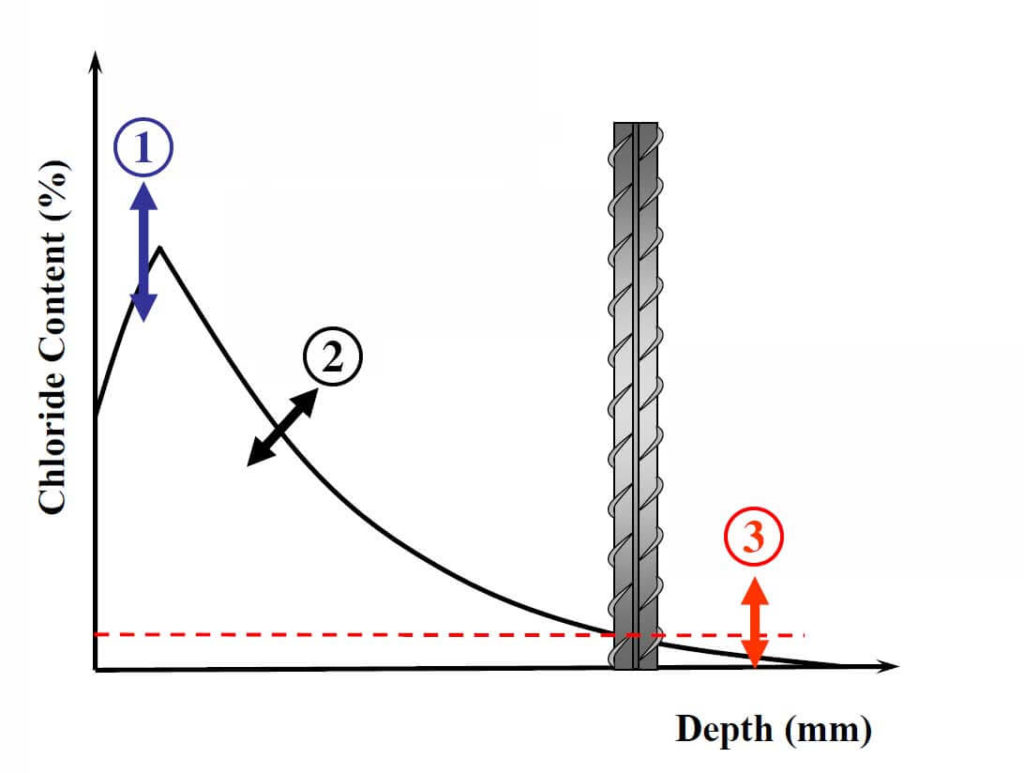
Given that the above parameters are known, the time to initiation can be predicted using Fick’s second law, which reads:
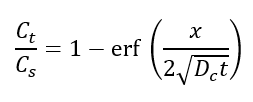
where Cs is the surface chloride concentration, Ct is the chloride threshold, x is the cover depth, Dc is the chloride diffusion coefficient and t is the time to initiation.
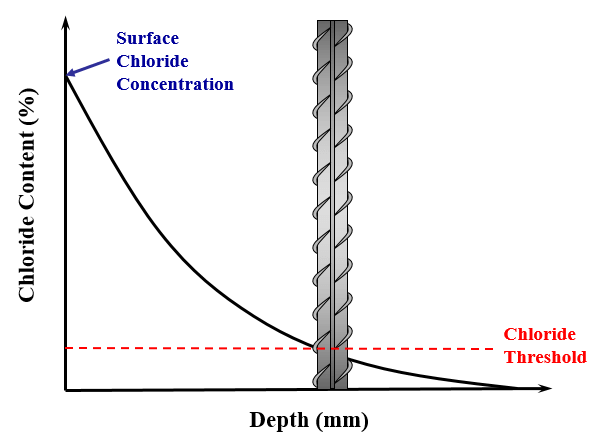
A graphical representation of Fick’s second law can be seen in Fig. 1. This clearly identifies the surface chloride concentration, which is the chloride concentration at a depth of zero, and the chloride threshold, which is the chloride concentration at the surface of reinforcement at the time of initiation.
Estimating these three parameters has been shown to be very challenging, if at all possible, considering the current state of knowledge. This is since these parameters vary considerably due to a number of variables; as shown later on.
Estimating the Diffusion Coefficient
The diffusion coefficient, which describes the propagation of chloride (or other forms of) ions, has been the most studied and best understood parameter (in terms of experimental procedures and prediction methods) in the literature. It has been shown to vary considerably depending on the water-to-cementitious-materials ratio (W/CM), age, cement type (and chemistry), use of pozzolans or slag, temperature, and curing regime. Several models have been developed in the past to predict this parameter, using experimental results or using theoretical concepts, and have shown to agree with experimental results closely. Examples of such models include: Stadium, ConcLife, Duracrete, ClinConc, MsDiff, CONDUR, and Life-365.
The most straight-forward experimental method to find the diffusion coefficient is the salt-ponding test (ASTM C1556 or other similar test methods), which simply includes preparing a concrete specimen of at least 20 mm thickness from a drilled core, or a molded specimen. The specimen is preconditioned in saturated calcium hydroxide as specified by C1556 then exposed to a chloride solution for at least 35 days. After the exposure period, the sample is ground in appropriate depth increments and the powder is collected for the acid-soluble chloride-ion content determination according to Test Method C1152. Using the chloride distribution throughout the depth, the diffusion coefficient is determined using Fick’s second law.

Other methods, based on electrical impedance or ion-migration under an electrical field, have also been developed to indicate, indirectly, the ability of concrete to resist chloride diffusion. These methods are based, in simple terms, on the fact that ionic flow (or chlorides ions flow) and electrical current travel similar paths through concrete, within the concrete’s pore network. These methods have the advantage of being very rapid compared to the salt-ponding test. It has been shown that results from such methods can correlate to diffusion coefficients obtained experimentally (through ASTM C1556 or field-exposure). However, it must be mentioned that there are differences between the fundamentals of flow in ion-migration testing and natural diffusion. Ion-migration or impedance-based methods are affected by the amount, type, and mobility of ions in the pore solution, and therefore the results need to be corrected by the pore solution conductivity. These methods also do not capture the interaction between the cement paste and chloride ions (a reaction in which the paste can bind/hinder the movement of ions). It has also been shown that the preconditioning associated with these methods may lead to filling air voids, which subsequently leads to a flow of current in those voids, although in natural exposure chloride ions typically do not flow in such large voids.
The diffusion coefficient is also not a constant parameter and the results obtained at a certain time (28 days after casting for instance) are not necessarily representative of the diffusion coefficient throughout the service-life. The diffusion coefficient generally decreases with time; due to the refinement of the pore structure and the change in pore tortuosity and connectivity associated with continuous hydration. The factor of decrease in diffusion coefficient depends on the W/CM, curing and the use of pozzolans and slag. The extent of pore structure development and the subsequent decrease in diffusion coefficient can be determined using frequent salt-ponding testing, at different ages, or more simply from the increase of electrical resistivity over time.
Although it is not very challenging to measure diffusion coefficient of concrete (compared to the other two), it should be mentioned that in actual field exposure conditions, diffusion due to concentration gradients is not the only mechanism of chloride ingress. Capillary suction, sorption and, in some cases, wicking action does happen. This further contributes to the uncertainty of the use of laboratory-obtained diffusion coefficients in service-life prediction. This is especially prevalent in cases where wetting and drying cycles or periodic de-icing salt applications exist.
Estimating the Surface Chloride Concentration
The surface chloride concentration is also a very important parameter; although the estimation of this parameter has not been extensively treated in the literature and some models assume a constant number that is solely dependent on exposure conditions. This parameter is highly affected by both the exposure condition as well as the concrete parameters. Factors that affect the surface chloride concentration include: the exposure condition (marine tidal zone, splash zone, de-icing salt application, etc.), cement content, surrounding environment chloride concentration, carbonation, the ability of cement paste to chemically or physically interact with chlorides (binding/hindering their movement), loss of surface due to freeze-thaw and scaling, among other factors. For instance, long-term monitoring of the surface chloride from concrete structures showed that the order of the surface chloride for marine exposure is: tidal > splash > atmospheric zone, with substantial differences between surface concentrations in each of these exposure conditions. It has also been shown that different concretes exposed to the same condition can show substantially different surface chloride concentrations.

Another complication in this parameter is that chloride profiles obtained in real structures often show an increasing trend from the surface to the interior to reach a maximum value and decrease after towards the internal zone; which does not follow the assumption of Fickian diffusion shown in Fig.1. This means that in this area, chlorides do not flow due to the concentration gradient. Some explanations of this include: (1) absorption and evaporation of water during wetting and drying, in which the pore water is moved inwards or outwards through convection, (2) decrease in pore water pH due to leaching or carbonation which releases chlorides bound within the cement paste into the pore solution (the compounds formed when cement paste interacts and binds chlorides are only stable at specific pH ranges), (3) precipitation of compounds during exposure, which can behave as barrier for the penetration of chlorides.
Estimating the Chloride Threshold
The chloride threshold has been the main topic of interest during recent years. This parameter has shown a very large scatter in the literature where, in a recent review, it has been shown that values reported in the literature range from 0.04% to 8.34% by weight of cement (Angst et al., 2009). This has been ascribed to several factors including the steel/concrete interface, pore solution pH and chemistry, cement type, electrical potential of the steel surface, moisture and oxygen content of the concrete pore solution, the compound associated with the chloride, the chloride binding capacity, and the method of threshold determination. Each of these factors affects the threshold differently and the extent of change in threshold associated with changes in these parameters is not fully understood and is far from being quantified (especially for the effect of the steel-concrete interface). Although several test methods have been suggested in the literature, to find this parameter in a feasible time, it was found that these methods do not correlate to each other and, in some cases, do not represent the actual field conditions. Therefore, there is currently no method to measure this parameter and no reliable data on values that can be used. The most pragmatic approach is the use of values that are thought to be conservative. However, such a choice can change the predicted service-life considerably.
1: The Surface Chloride Concentration is Influenced by:
- Exposure condition
- Cement content
- Surrounding environment chloride concentration
- Carbonation
- The ability of cement paste to chemically or physically interact with chlorides
- Loss of surface paste due to freeze-thaw and scaling
2: The Diffusion Coefficient is Affected by:
- Water-to-cementitious-materials ratio (W/CM)
- Age
- Cement type (and chemistry)
- Ability of cement paste to bind chloride
- Use of pozzolans or slag
- Temperature
- Curing regime
3: The Chloride Threshold is Affected by:
- Steel/concrete interface characteristics
- Pore solution pH and chemistry
- Electrical potential of the steel surface
- Moisture and oxygen content of the concrete pore solution
- The compound associated with the chloride
- The chloride binding capacity
- Steel surface condition
The Difference Between Time to Initiation and Time to End of Service-Life
Finally, even if it is assumed, hypothetically, that the time to initiation is determined, the time to end of service-life (typically assumed to be the time to cracking due to corrosion products formation) can not be determined without the knowledge of the corrosion rate and the amount of corrosion products required to cause cracking and spalling. Although significant progress has been made on measuring corrosion rates, there is no clear guidance on the amount of cross-section area loss required to cause cracking. Therefore, after initiation occurs, prediction of the end of service-life can not be determined with certainty.
Current Codes and Guides: Examples of Rolling the Dice
This short review clearly indicates the uncertainties associated with the parameters required to predict the time for corrosion initiation. An example of these uncertainties and the degrees of freedom associated with the chosen parameters can be seen in Fig. 2 (note that this is not an exhaustive list of all the factors affecting the service-life, but only a few examples). This can lead to substantial differences in predicted service-life depending on the chosen parameters. Interestingly, CSA or ACI standards include guidance such as a maximum W/CM or a minimum strength for different exposure conditions (for a marine exposure ACI 318 specifies a maximum W/CM of 0.4 and a minimum strength of 5000 psi). Such outdated guidance is very disconnected from the above discussion (for instance, two concretes with the same W/CM but made with cements having different C3A contents are expected to have a different diffusion coefficient, surface chloride concentration and chloride threshold); specifically, the connection between minimum 28-day compressive strength and time to initiation is not understood by the author for cases with no freeze-thaw exposure (some pozzolans, such as fly ash, decrease the early-age compressive strength but also decrease the diffusion coefficient significantly). It seems that a movement from such guidance towards specifying a certain diffusion coefficient for instance, or performance-based specifications would fit more with the current state of knowledge.
It seems that the challenges in service-life prediction can only be overcome through the development of performance-based specifications and standardized test methods that can capture the aforementioned parameters accurately. It also seems that a way to decrease the uncertainties in service-life prediction parameters is continuous monitoring of structural elements throughout the service-life. This would generate enormous amounts of data on such parameters. Such data, if generated and shared properly between the industry and researchers, will advance the field of service-life prediction immensely. This can only be attained through IoT solutions in which, in simple terms, structures can communicate data (such as resistivity or the time at which initiation occurred for instance) to owners, contractors, producers, or researchers. Such IoT solutions are currently available and a great deal of advancement will be expected in the near future in methods that can capture accurately and remotely all of the parameters required for monitoring and evaluation.