As part of Giatec’s continued efforts and goal to meet customer requirements and expectations, progressive changes are being made to the system to better comply with updating needs. Working with clients on a global scale, we strive to provide a streamlined platform that is one place for all. With the feedback collected from our valued customers several updates and transitions have been made to the SmartRock Web program, especially the ‘Charts’. To learn what the updated site has to offer and how beneficial this can be to the end-user, this blog will serve as a walkthrough to explore the new chart features in-depth.
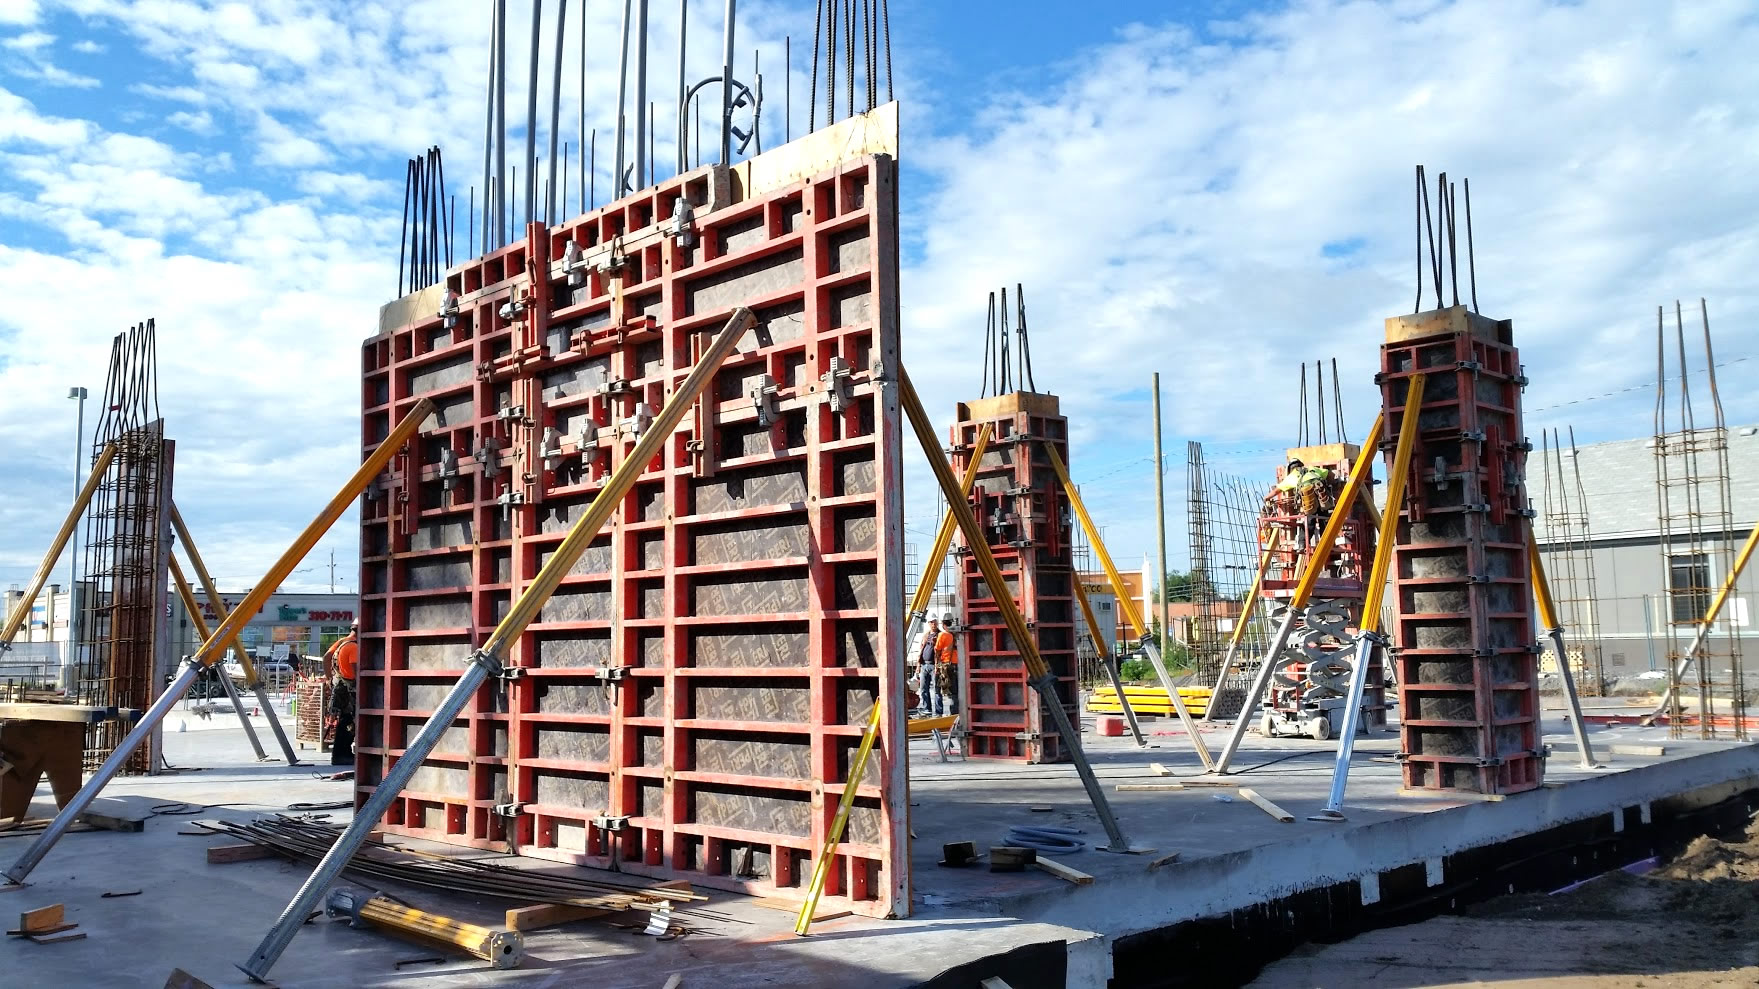
Build Data Centers Faster with SmartRock® Long Range
A Complete Package – Temperature, Strength, and Maturity Charts
Designing and generating charts can require considerable time and effort; sorting the data entries into one place and exporting them in your desired formats.
SmartRock Web serves as a one-place solution. Using this system platform, a user can generate all types of charts and reports – Temperature, Strength, Maturity, etc. Much effort has gone into making the charts able to be customized as per the user’s preference, which makes it a complete package and personalizes the data to any situation.
The following post focuses on the improved aspects of the charts that would make the user’s project more efficient, economical, and safe by using comprehensible graphs and diagrams.
Temperature & Strength
With the new SmartRock Web updates, displaying temperature and strength data beside each other in a graph proves to be the best way to visualize your concrete curing. The updates also allow personalization options to tailor your data to each individual job site.
As the sensors record data, the charts reflect the constant graphical updates. The charts also display the indication of the pouring time (before pouring time represented as a grey bar/area), thresholds if assigned, and with our dual temperature SmartRock sensors, the body and cable temperature in distinctive lines over the chart.
The strength data is represented in the same chart as the temperature with distinctive markings for data from the body and cable. A useful aspect of the chart updates is that they can be further personalized to a user’s preference which includes features such as – Display, Data Selection, Data Range, Expanded chart view, and Sensor selection. With the changes enacted, these charts can be generated in PDF formats.
Let’s emphasize further what these features have to offer in-depth followingly.
Data Information Tab
The charts act as a visual medium, a user can simply understand if the temperature and strength data are heading in the right direction i.e., the target strength, and maximum temperature to be reached, by looking at the transition of the curves. But to find out the exact figures is of utmost importance; the data information tab will fulfill this need. A user can find the exact temperature, strength, date and time, time from pouring, limits that include maximum or minimum temperature, and the target strength if assigned – all through navigating with the system cursor. This data information tab will establish the assurance the customer is seeking, to be able to find the exact numbers that they wish to foresee and act in relation to that.
With your sensors constantly updating and collecting live data, the charts reflect this collection. With the help of the data information tab, all changes can be effectively tracked, plugged directly into the graphs, and exported to make faster decisions on-site and off.
Keep learning about the updated SmartRock Web charts in Part 2 where we look into graph customization tools!